Taming 2D Transforms in HTML5 Canvas
This is the second post in a series on creating custom interactive visualizations in canvas. The first post is here.
The canvas API contains five methods (rotate, scale, translate, transform, and setTransform) used to transform the drawing context. We typically use the transform API when we want to rotate or scale some element of the visualization (especially text). In canvas, we don’t actually move the elements. Instead we transform into a new coordinate system where the element is no longer scaled, rotated or translated and then draw normally. The difference is subtle, and you can get by with ignoring it so long as you remember to execute the transforms before you draw. But, once you embrace this way of thinking, transformed coordinates can be a powerful way to break down complicated drawing tasks into simple steps. In the remainder of the post I’ll describe how to use transforms effectively and how to overcome the difficulties involved in making transformed objects interactive.
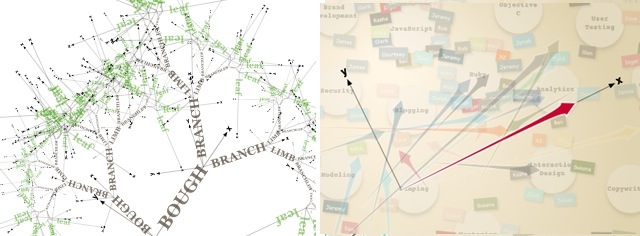
Examples: (an HTML5 browser is required to view these)
![]()
![]()
The Basic Idea
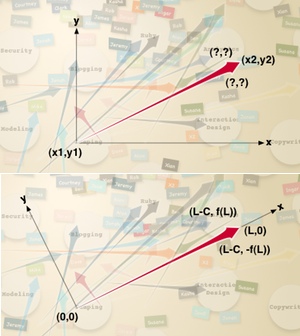
In the interest map project I described in a previous post, I want to use bezier curves to draw arrows using my own formula for the ratios of the arrow length, arrow head length, and arrow head height. The x and y coordinates of the head and tail of the arrow are known, but using these to figure out the location of the sides of the arrow head and its control points require a lot of rather messy trigonometry. If we create a coordinate system where the tail of the arrow is at the origin and the head lies on the x axis (this still requires a little bit of trig), the coordinates simplify to {0,0}, {l-C,f(l)}, {l,0}, and {l-C,-f(l)} where C is the length of the arrow head and f(l) is a function that gives its height. Also notice that, after a transform, we can use the same code to draw the horizontal and vertical axes (so long as we can handle the difference in lengths). Complex visualizations can usually be broken up into components like this that each have a natural coordinate system. The trick then becomes calculating an appropriate transform.
A Bit About The Math
I’m not going to get deep into linear algebra or affine geometry, but I think a little knowledge of how transforms are implemented is required to use them effectively. Any change of coordinates can be represented by a single transformation matrix.  You don’t need to know what a matrix is so long as you understand that it’s kind of like a number in the sense that you can multiply it with points or other transformation matrices. When you multiply a point from your transformed coordinates with a transformation matrix, you get another point that is transformed back into the original coordinate system. The canvas context always has a transformation matrix, and whenever you call a drawing API method (e.g. fillRect, bezierCurveTo, arcTo, etc.) it multiplies each of the points by this matrix before it renders any pixels from the shape to the canvas.
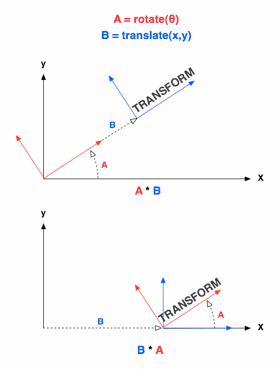
When you multiply a transformation matrix by a another transformation matrix, you get a new transformation matrix that is a combination of the two. For example, if you have a transformation, A, that represents a coordinate system rotated 45 degrees and another transformation, B, that represents a translation of the origin 100 pixels along the x axis, then C=A*B is a transformation where the origin is 100 pixels out on the 45 degree line. A lot of the power of Canvas’s transformation API derives from the ability to combine transforms like this. With the exception of setTransform(), all of Canvas’s transform methods (rotate, scale, translate, and transform) are applied by creating a matrix representing the operation and then multiplying it with its current transform to create its new transform. One important different between matrix multiplication and normal multiplication in that matrix multiplication does not commute (A*B != B*A). So you’ll get a different result if call context.rotate() and then context.translate() than you would if you called context.translate() then context.rotate().
Save and Restore
The save() and restore() methods in canvas are a convenient way to avoid specifying stroke and fill styles over and over again in a drawing, but they become critical when you start using transforms. The save() method takes all the current state of the canvas context including the current transform and pushes it on a stack. You can then make as many modifications or transforms as you like. When you’re done drawing, you call context.restore() and everything is back to the way it was before you called save(). You can always reset the fillStyle or lineWidth, but there is no trivial way to reset the transform (you can use setTransform() if you really know what you’re doing). Using save() and restore() is habit you want to acquire.
Some Concrete Examples
Alright, enough theory: Here’s some code. The first example is the obligatory fractal demonstration. 2D transforms make quick work of fractals, because, by definition, they are the same thing over and over at different scales and in different places. At any rate, the application first creates a binary tree (see the full source). Then, beginning with the trunk it draws the text at the origin (in its transformed coordinates). Then, for each branch, it translates the origin to the end of the word, rotates in the direction of the next branch, and scales to the size of the branch. It then repeats the process until it gets to a leaf.
function draw() {
    var ctx = document.getElementById('display').getContext('2d');
    ctx.font = 'bold 30pt Georgia,Times New Roman';
    ctx.translate(ctx.canvas.width / 2, ctx.canvas.height);
    ctx.rotate(-Math.PI / 2);
    draw_branch(ctx, tree);
}

function draw_branch(ctx, branch) {
    ctx.fillStyle = branch.branches ? WOOD_COLOR : LEAF_COLOR;
    // draw text in default font
    ctx.fillText(PARTS[branch.type], LEFT_OFFSET, TOP_OFFSET);
    if (!branch.branches) return;
    for (var i = 0, b; b = branch.branches[i]; i++) {
        ctx.save(); // IMPORTANT!!
        // move origin to end of text
        var text_width = ctx.measureText(PARTS[branch.type]).width;
        ctx.translate(text_width + LEFT_OFFSET, 0);
        // scale coordinates to predetermined value for branch
        ctx.scale(b.scale, b.scale);
        ctx.rotate(b.theta); // rotate axes to be in line with branch
        draw_branch(ctx, b);
        ctx.restore(); // IMPORTANT!!
    }
}
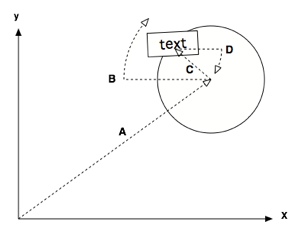
The name tags in the interest map (source) presented a more realistic problem. We wanted to simulate the way people attached their name tags on the skill cards.  The placement of each name tag was essentially random except that the tags were always near the edge of the card and they were always nearly horizontal. This requires 4 transforms: A translation to the center of the skill card (A), A rotation to give it a unique position on the card (B), A translation to the edge of the card with a random messiness factor (C) and a rotation back that’s roughly equal to B so the text is roughly horizontal (D). The following is the (somewhat simplified) function that transforms the coordinates then draws the box and the text around the origin. In this function, the angle of the name tag on the card, r, is given.
function nametag(ctx, cardx, cardy, person, r) {
    var text_width = ctx.measureText(person.name).width,
        width = text_width + 10;
    ctx.save();
    // make center of card the origin
    ctx.translate(cardx, cardy);
    // rotate in direction of tag placement on card
    ctx.rotate(r);
    // translate to edge of card (with a little permutation)
    ctx.translate(-TAG_RADIUS - +4 * Math.random(), 0);
    // rotate back with permutation so that text is nearly horizontal
    ctx.rotate(-r + .4 * (Math.random() - .5));
    /* ... set box style parameters ...  */
    // draw box centered around (transformed) origin
    ctx.beginPath();
    ctx.rect(-width / 2, -10, width, 20);
    ctx.closePath();
    ctx.fill();
    ctx.stroke();
    /* ... set font style ... */
    // draw text centered around (transformed) origin
    ctx.beginPath();
    ctx.fillText(person.name, text_width / 2, 0);
    ctx.closePath();
    draw_nametag(ctx, person, interest);
    ctx.restore(); // DON'T FORGET!!!
}
Most of the time, thinking in terms of coordinate transforms will make your life a lot easier. The exceptions come when you need to relate shapes drawn in one coordinate system with shapes or points specified in another. This is especially true when you need make transformed elements interactive. I’ll talk more about this problem and some solutions in the next post.
Alex Cruikshank
Alex is Carbon Five's resident mad genius. He is recently very involved in functional languages, and has been anchoring teams at C5 for the past decade.

