Delivering value, Making money
When I begin working on a new product, I’m always looking for ways to optimize the interactions for business and user value. I believe the best way to accomplish that is to get to market as early as possible with the proposed value. By getting to market, I mean everything from talking with customers about the value proposition to releasing the smallest version of the product. You may know this method as Lean Startup. Even if you don’t, read on.
At Carbon Five, we don’t often use the word lean, but it’s not because we don’t believe in it. It’s because we don’t believe in being dogmatic about it.

Our process values flexibility, sustainability and reason. We aim for a middle ground — building what our clients think they want to build, while providing ways to learn along the way.
Start with a vision
No matter what you are setting out to build, the team must have a specific problem to solve and a reason to solve it. With all the buzz around lean startup and experimental labs, I often hear the word “process,” as in, “we want to learn the process” for building products that get traction. Books like The Lean Startup and Running Lean make it seem like an easy formula you can apply. In my experience, the team needs a strong vision they actually want to execute in order to apply these practices. You can learn the ideas from books and workshops, but validating a product means actually believing in why you are building. With that, you can keep an open mind about the how and remember that the most successful products adapt to changing conditions.
I’m going to walk through the most recent series of exercises we did with a client. The goal of the project was to increase mobile conversion on their existing web flow where customers apply for a financial service. While there are many repeatable exercises, I see the activities we use as more of a toolkit than a process. We like to say we choose the right tool for the job, so take this series as a story, not as a manual.
De-risking big ideas
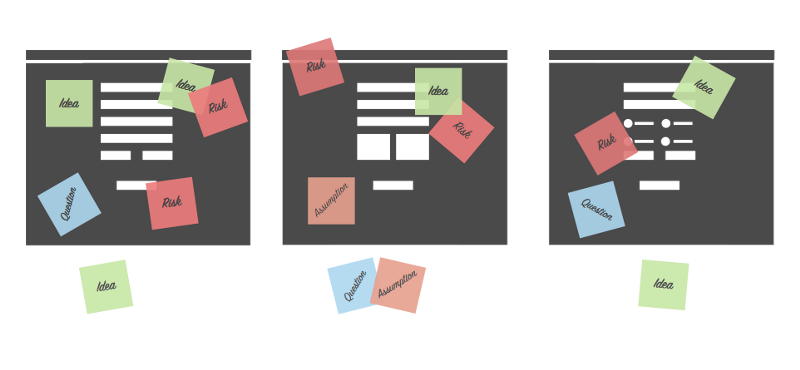
When we kicked off our last project, the goal was to optimize an existing web application. We started by walking through the product and identifying ideas to make the experience better and increase conversion. We used different color post-it notes to color-code:
- Ideas to increase conversion
- Questions that needed to be answered in service of that idea
- Risks within the ideas
- Assumptions we made in the ideas

The exercise helped us flesh out as many ideas as possible so we could evaluate which ones had the most potential and which had the most risks. If we hadn’t had an existing product to work off of, we could have used an experience map.
Luckily, the product team brought a lot of ideas to the table, but we also took a look at some products they admired and unpacked how we might apply similar principles. For example, we discussed why everyone liked Airbnb, Uber and other players in the existing tech landscape. These questions inspire further ideation using the x for y cliche.
If we made Airbnb for our vertical, how might that be distinctive?
How does Airbnb make us feel?
Why do we use it? (or why not)?
What values come across in Airbnb’s product?
Which ones resonate for our product?
Ideating experiments
Based on the plethora of ideas we laid out, we ran a classic design studio exercise known as six-up sketches. We timed a couple rapid rounds of sketching and sharing our ideas (about 10 minutes of sketching, 20 minutes of sharing, run twice). The goal of six-ups is to quickly externalize as many product directions as possible. It’s not important how well you draw. Instead, the focus is on the key interactions—the magic dust of the experience.
Six-up sketches can be used as a way to generate six different solution ideas or one walk-through of the solution. The great thing about six-ups is that they expose what matters to each person on the team. They also expose assumptions about customers, their behavior and technical implementations.
 We use 11×17 paper and sharpies to make sketching more accessible
After each round of sketching, the team goes around the room talking through their ideas, not for feedback, but to stimulate more ideas. By the end, we had more than twenty ideas for experiments we could run.
Planning for learning
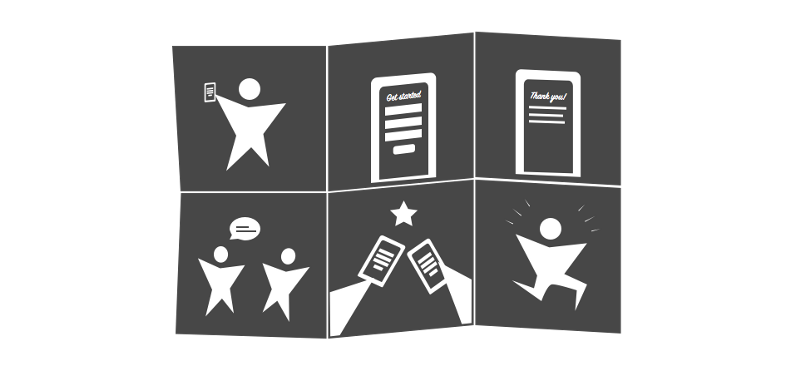
We took the ideas we laid out in the risks exercise and the six-ups and made several storyboards. This time, we wrote a hypothesis for each idea we discussed and sketched out a rough storyboard for a lightweight execution.
The new six-up sketches provided a bit more definition, so we then added technical risks and assumptions. Our product owner prioritized them based on the biggest unknowns that could possibly provide the most business or user value.
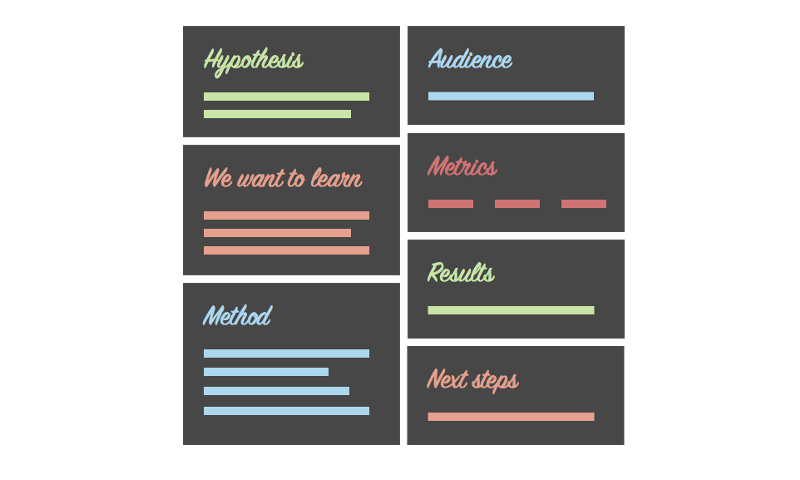
From there, we wrote experiment plans. The key components of an experiment plan are
A single, testable hypothesis
A simple format is “If________, then ________will happen” but anything that can be proven or disproven will work.
What we want to learn
I find this helpful because it keeps the hypothesis in check. This can also capture qualitative insights that help unpack data.
The method for testing the hypothesis
Outlining how the experiment will be executed is useful when prioritizing the work. This is a simple game plan like “A/B test the headline text with 50% traffic on tagline 1 and 50% on tagline 2″.
The audience for the experiment
This prompt is focused on how you will acquire customers for the experiment. Experiments can be run with a small, in-person user test or with an ad-buy.
Metrics that prove the hypothesis
Start with the one metric that matters and add some supporting metrics. I think a max of five metrics is plenty, but ideally, it’s more like two.
 Experiment plans can be physical or digital
Once the experiment is complete, it becomes an artifact that documents the learnings, which is especially important if it fails. To complete the loop, we’ll add:
Results
Both qualitative and quantitative feedback goes here. Obviously, all the data captured goes here. Sometimes, I’m able to get quotes and points of friction or success.
Next steps
An important conversation to have with the team. Next steps documents how the experiment feeds into the product development process.
The experiment plan/report format came from Mike Long’s experiment report template, which was adapted from Ash Maurya and Zach Nies.
Choosing metrics
Key metrics are the single most important part of running experiments. Choosing metrics that matter to your team and organization are crucial to growth and conversion. This may seem obvious, but it’s worth remembering. A good place to start is with Dave McClure’s pirate metrics:
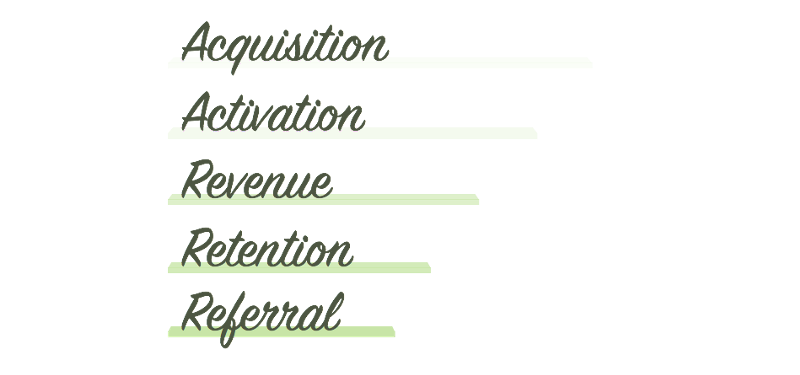 Pirate metrics: Acquisition, Activation, Revenue, Retention, Referral
The team (and key stakeholders) must define where each step of a conversion happens in order for accurate measurement. Is acquisition the first time someone hits your website or is it when they land on your Twitter page? What’s the one micro-metric you are looking at for each layer?
With our project, we were focused on events within the acquisition and activation process. These were as small as “clicked on x box” and as large as “went to y page”. The metrics that mattered were the ones we identified at the beginning of the project- the six steps of the activation funnel, but depending on the experiment, we added new micro-metrics to gauge performance.
Establish a naming philosophy
One of the complexities of working on an existing product is previous events and metrics tracking systems. Because the people who implement tracking (engineering) and the ones who make decisions (product owners) are different, we ran up against similarly named events, missing events and mis-matched data across the analytics platforms. My takeaway from this project is to establish an event naming philosophy and to document it in the most accessible way possible, so both product and engineering are clear.
Here’s why — when we kick-off an experiment, we are usually thinking about what needs to be deployed, not what the report will look like. We ran a few experiments that were hard to call because the data wasn’t clearly tied to unique events. We had events called “homepage” and “homepage — home,” for example. Since we were an experimental team, we were adding our own events on top of this without being able to remove these existing events. As a result, we had three events firing which made reports difficult to read.
Next time, I will take the time with the team to set unique names for the events we are watching. I will also take the time to clearly document them, with an annotated user interface, in a place all team members can access and contribute to it (i.e. probably not the code repository).
Measuring tools
For our project, we used Google Analytics, Optimizely and KISSMetrics all connected through Segment. Segment is a router for sending events to other platforms like the ones above. The engineering team is instrumental in setting these up and implementing metrics tracking, because they have valuable knowledge about how the product works. It’s not as easy as plugging in a JavaScript snippet—that’s just the entry point.
We started with Google Analytics because that’s what the team was already using. They had reports set up in there for measuring the same conversion funnel we were testing. The most helpful part of Google Analytics was the device and browser filtering to determine which were the most important for initial QA testing and we used the Events view to see all the events tallied up across the app.
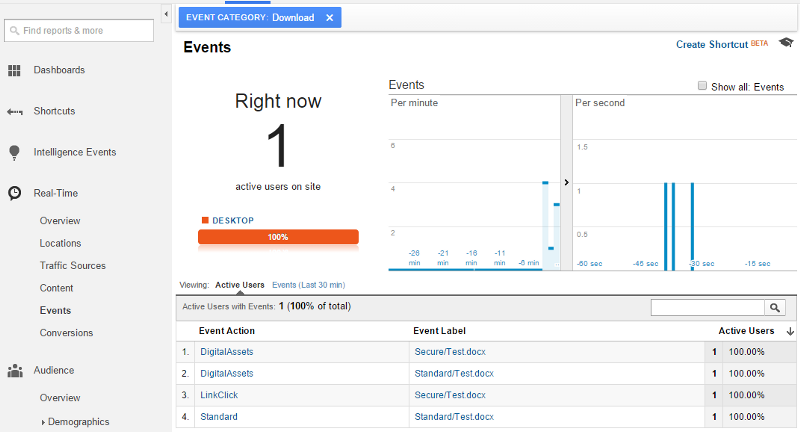 Google Analytics live events tracking
We quickly added Optimizely to help deploy A/B tests. Optimizely was receiving the same events that Google was receiving, but we were able to pull the ones we cared about into an isolated view alongside the experiment variations. It helped to quickly reduce the noise. Aside from isolating your metrics, Optimizely allows you to edit messaging or colors with their UI editor or redirect some traffic to a new URL. While the experiment runs, Optimizely’s new stats engine shows how many more visitors you need to call a winner.
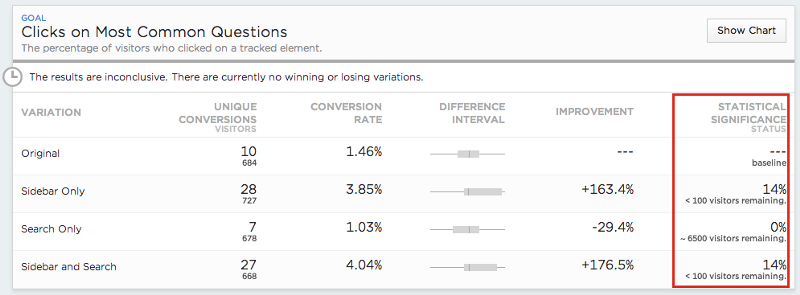 Optimizely’s new stats engine
After running some experiments, we decided we wanted to dig deeper into some of the data. Neither platform was giving us the answers we needed so we added KISSmetrics. Our favorite feature of KISSmetrics was discovered by our Tech Lead, Erik—viewing individual user journeys. The platform will tie events together to a single user, so you can filter traffic down to a population you care about (such as people who hit the homepage and complete email sign up) and then view everything they did along the way. It was through this tool that we learned why we were seeing the data. KISSmetrics offers an A/B testing library, conversion and cohort reporting as well. We already had solutions for those, so we didn’t use it to it’s full potential.
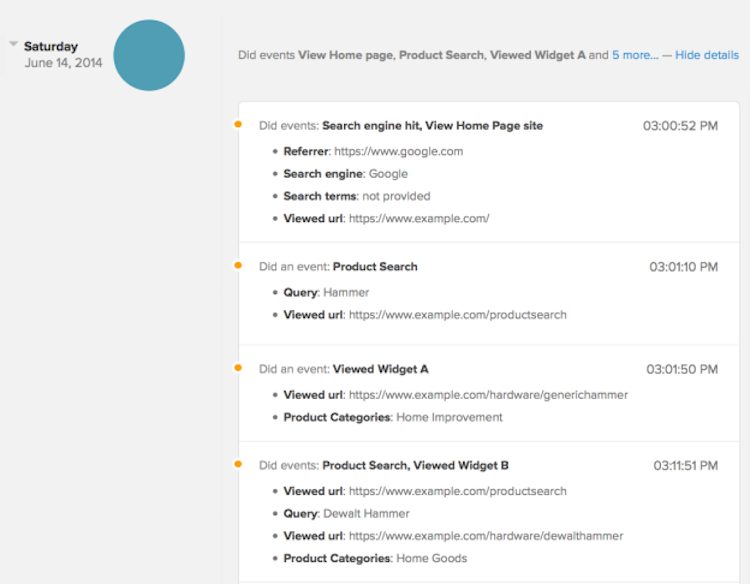 KISSmetrics journey mapping
There are plenty of other analytics tools. Here are a few I’ve come across:
Heap—Offers retroactive analytics as well as point and click tracking
Mixpanel—Another robust platform able to segment data into funnels and cohorts
Keen IO — Developer friendly, customizable dashboard
Amazon — Mobile app A/B testing
Unbounce — Landing page A/B testing
The hardest part of choosing a tracking tool is knowing what your team’s questions will be. An exercise we continually did throughout our project was to compile a list of questions we had when looking at data and user behavior. We keep a board of “We have learned” and “We want to learn”. The more your team reflects on this, the faster the data will become accurate and actionable.
_______
As a team, we ran these exercises multiple times throughout the length of the project. The next step is to run the experiments and continuously ship validated ones. That sentence reads much easier than it actually is. The important thing to remember is that this is not a prescription for success, but a repeatable set of activities to add to a toolkit. Take them apart, rethink them and add your own. Build products that deliver value and make money.
In part two of this post, I’ll talk about prioritizing delivery, running the experiments and folding the learnings back into the product. Onward and upward!