The Carbon Five Guide to User Research: Feature Definition
Welcome to the 4th of our User Research series where we share our insights into how to generate a list of features. In the coming paragraphs we’ll talk about how User Research can help with stakeholder management, generating a feature list, and prioritizing a feature list. This post focuses on feature definition, and making what we’ve heard actionable (and testable!). Our next and final post will cover a handful of methods to prototype the features we generate here.
In our last post, we worked on synthesis and analysis of user interviews. After a number of interviews, we refined our proto-personas and identified common experiences.
Stakeholder Management
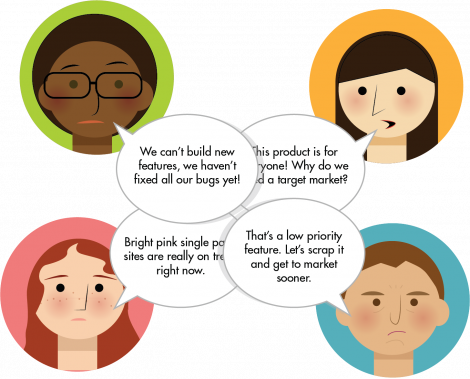
We’ve got more than one goal and more than one stakeholder. There are more than a few hurdles to building consensus. When dealing with many stakeholders, user research is a great tool. It can hold the seagull effect at bay, and keep stakeholders from swooping in at the last minute. It also helps us avoid random anecdotes gaining traction over data. Leveraging user research we avoid showdowns between stakeholders, designers, PMs and developers.
Let’s break out a spreadsheet. Beloved tool of ranked list makers everywhere.
Generating a Feature List
So we know we’re supposed to have this great long list of potential features. In this section we’ll talk about how User Research helps. It’s time to brainstorm (or brainwrite) with our entire team. This includes designers, business analysts, stakeholders and developers.
When brainstorming, a productive method is identifying the largest pain points that have been uncovered through your interviews. Tie them back to the personas that experience these pain points. Write the pain point and affected personas at the top of the page and post them up on the wall. Let each team member spend 10 minutes identifying solutions before they move on to the next problem. Our team will iterate on the solutions they see, while working in a vacuum that eliminates self-censorship.
We will develop a long list of features that solve the motivations behind the pain points of users. In a sense, users give us their symptoms and this is our chance to treat the underlying issue.
Let’s use Mileage, a theoretical rideshare app, as an example. Users often use Mileage to travel well-worn routes. Even so, they are often communicating their status to friends and family. We might add a feature to our list that let users share their ride continuously. The hypothesis is that this would help allay fears, and also would cut down on app-switching and communication off-platform.
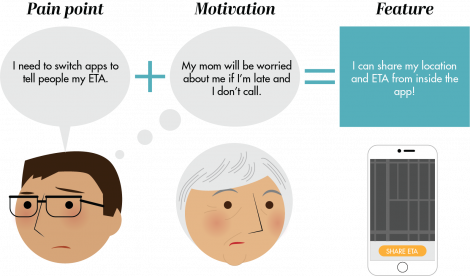
The pain point may have been: Switching apps to text people about where I am
The motivation is: To communicate where you are during your travels, over time.
The feature we add to our list is: Sharing your ride
Look outside the box
When we’re building a list of features, it’s the best time to bring in the entire team. Business analysts and product managers can shed additional light on topics. Developers can come up with technically interesting solutions. By including a diverse group we can maximize the number of ideas in our list and learn from others.
Prioritizing Features: Risk vs Reward
There are a wealth of methods to prioritize features. Any method is acceptable as long as the results are defensible, and easily communicated. We’ll use a Risk versus Reward ranking. This will help us figure out which features are the most valuable.
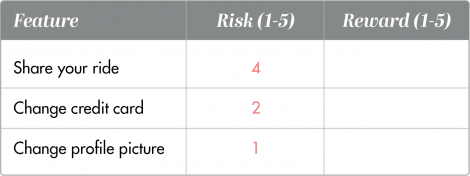
The factors that make up risk or implementation can include:
- Time to market including time to define, build, test, and get stakeholder buy-in
- Development skill and expertise in a given area including design and engineering resources and domain expertise your team might currently lack
Assign each feature a number from 1-5 indicating the risk level. 1 indicates the lowest risk, and 5 being the highest.
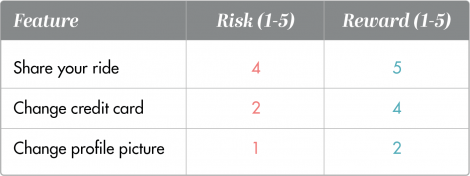
The factors that make up reward or impact include:
- Factors differentiating your product from competitors
- Features that increase the key metrics you’ve already defined, such as conversion, session time, and client lifetime value. You can read more about defining KPIs here.
- Ease of implementation
- Staying ahead of the competition
Assign each feature a number from 1-5 indicating the reward level. 1 indicates the lowest reward, and 5 being the highest.
Ranking
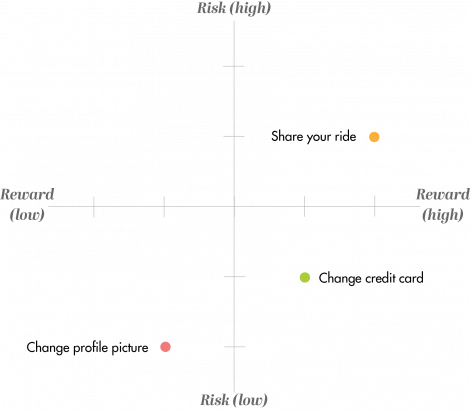
Now that we’ve finished the generation and ranking process. It’s time to revisit middle school graphing! Plot the features on the matrix below. Your risk number will go along the x-axis, and your reward number along the y-axis.
Generally, your team should pursue features that are low risk/high reward. The next set of priorities often depends on the composition of your team, the type of business, your funding runway, and the competitive landscape.
Wrapping It Up
Using these tools we take our feature prioritization out of the “gut check” arena and into something more rational. It’s easier now to identify the features on which we want to spend precious time and where to focus our prototyping efforts. More importantly, we can externalize and share this information with the extended team.
There are a number of tools to express this list of features, to various levels of structure, from Pivotal Tracker to Stickies.io list.
In our next post we’ll prototype these features and take them out into the real world. Features will jump off the page into an interactive experience. And when we test these prototypes, we’ll have yet another opportunity to engage with users and continue to improve our understanding of their needs.
One last thing—if you need help or want to try this firsthand with Carbon Five, look into our User Research Sprint.